Seeing through the veil of overflowing information and insights is hugely important when trying to identify the best strategy for DeFi investments. The landscape of the sector is incredibly diverse with over 5,200 different protocols to choose from and 11,000 pools to invest in. These numbers do not include direct staking, delegated staking, automated strategies, and other novel investment instruments available to DeFi investors.
Looking at the industry as a whole is quite difficult due to the fragmentation of the sector. Nevertheless, you must try your best to analyze the general disposition of things within the ecosystem to make informed decisions. We are going to discuss several methods for estimating the growth of DeFi and talk about some projects that serve as good examples.
Note that we do not provide financial advice. The information in this article is for educational purposes only. All readers are encouraged to do their own research.
Growth of the DeFi market
In 2025, the size of the decentralized finance market will be respectable enough to attract the attention of large capital holders. In 2024, the cumulative TVL growth of the industry was close to 147% with the combined TVL of all protocols reaching $136 billion in December. While it is still not even close to the ATH of over $177 billion achieved in November 2021, the positive dynamic is a good thing to see.
The number of unique wallet addresses within the Ethereum ecosystem has grown massively reaching 20.8 million in December 2024. In January 2025, the number decreased to 17.4 million but it is still a 248% growth year-on-year.
All these statistics make it seem like the industry is experiencing a massive success and can break through into the mainstream within the next couple of years. However, you should be cautious and look at other sets of data. For instance, the impact of market volatility on DeFi can be huge with TVl numbers strongly correlating with the total market cap of the cryptocurrency market.
Here are some examples:
- The global market cap of all crypto coins grew by 106% from $800 billion to $1.72 billion in 2024.
- The combined TVL during the same time grew by 46% from $38 billion to $56 billion.
- From March through September 2024, the total market cap fell by 22.3%.
- During the same time, the TVL dropped by 7% overlapping with the market cap chart.
While amplitudes differ, the general direction of the market often dictates the disposition of capital holders toward the DeFi sector. Investors who are interested in short-term gains must take these movements into consideration when trying to find the best moment to enter the market.
Key metrics for DeFi analysis
The decentralized finance ecosystem is quite diverse with thousands of investment options to choose from. However, it is important to take time and analyze projects carefully.
Here are some metrics you can use to evaluate the potential of a certain decentralized protocol:
- Total value locked or TVL is a metric that shows how much money is locked in all pools operated by the protocol. It is a good indicator of investor confidence and the popularity of any given project. In certain categories, leading platforms represent a massive chunk of the combined TVL. For instance, all liquid staking protocols have a combined TVL of over $48.7 billion while Lido manages 50.9% of this volume suggesting a higher degree of trust from investors.
- Volume is a good metric when judging decentralized exchanges and automatic market makers. In many cases, higher volume means higher utilization of pools and strong revenue numbers. Some DEXes are better than others at facilitating user engagement. For example, Curve DEX is the second-biggest exchange on the Ethereum network but it generates less volume than Pancakeswap which is slightly smaller in comparison. The weekly volume of Curve DEX was just $1.884 billion while Pancakeswap generated over $20.9 billion.
- Mcap to TVL ratio is another interesting metric that can be used for protocol evaluation. Examples of successful and unsuccessful projects include protocols that have high and low Mcap/TVL ratios. Finding a correlation here is difficult. However, a smaller ratio often means high investor confidence and underevaluation. For instance, the Eigen protocol is one of the most successful restaking projects on Ethereum that has an $11.8 billion TVL but the Mcap is relatively low making it one of the weakest big protocols in terms of Mcap to TVL ratio with its 0.03 value.
- User activity is hard to measure correctly since a single person can operate multiple wallet addresses diluting the data. Nonetheless, the number of unique wallet interactions and the increase in the number of unique wallets can be used to evaluate the popularity of the project. A good source of data is Dune.com which is an on-chain data aggregator that has various charts, tables, and graphs with information collected within the Ethereum ecosystem. User engagement is hugely important given how communities shape trends in DeFi.
These metrics can be used to assess various protocols and identify platforms with a strong potential for development and growth. On the other hand, people interested in increasing risk premiums by interacting with high-yield protocols may also consider APYs and make sure to work with protocols that allow users to consistently beat the tradfi and CeFi yields.
Analyzing DeFi market growth
Identifying the course in which the market is going can be difficult even for seasoned veterans. Newcomers are often overwhelmed by information and cannot make a correct decision. One must remember that the DeFi ecosystem is tightly connected to the larger, mostly centralized crypto market dominated by Bitcoin. Learning technical analysis is quite important to make prognoses for the DeFi sector.
Here are some platforms and instruments you can use to identify strong trends in decentralized finance:
- TradingView is the best smart terminal for retail traders. It is a powerful tool that allows users to apply over 100 technical indicators and innumerable graphical tools to any chart. Automatic alerts, strategy testing, custom strategies, and many other features make it easier to analyze price action.
- DeFiLlama is an excellent tracker that covers 90 chains and over 5,000 different protocols. It is a great place to look for valuable information like TVL, market cap, volumes, revenues, and other information about protocols.
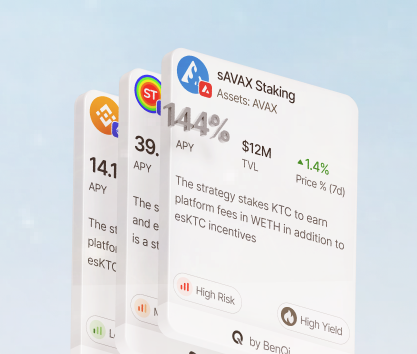
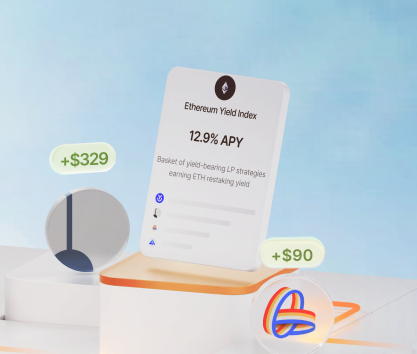
- Rivo.xyz can be a game-changer for many crypto investors seeking advice and comprehensive analytics. It is a platform offering a variety of strategies picked by experts and a multi-functional wallet that can easily interact with many DeFi protocols.
- Dune is the best source of on-chain data for users of the Ethereum ecosystem. The information here is presented in various custom charts and tables. If you don’t mind spending some time searching for something specific, you will be more than happy to use this website.
The future of the DeFi market
All current indicators show that the sector has a very positive growth dynamic. Despite the slight reduction in TVL and market cap, the general trajectory is still upward. We are seeing a 246% increase in the number of unique wallets in the Ethereum ecosystem and a solid 147% TVL growth suggesting that investors are very interested in exploring the DeFi sector.
The only issue is the role of regulators in DeFi developments which is still unclear. The lack of regulatory guidelines is the only factor that slows down the growth due to the indecisiveness of institutional investors to join the sector.


